Aegis Rhinoworks is proud to unveil Aegis Analytics version 2.0. A culmination of a year and a half of rework, updates, and feedback implementation from our users culminating in the best construction analytics platform on the market.

What’s new?
- We’ve given the product a major facelift, improving usage and showing off our new Logo
- Schedule Analysis in Quality Control can now be interacted with and searched through to pinpoint tasks and relationships causing issues
- We’ve improved the performance of the UI and Report Generation to ensure speed and accuracy.
- Schedule uploads can now be downloaded, edited, replaced, or removed. Analytics will now automatically sort all files by data dates for accuracy.
- Introducing: Risk (BETA)! Along with our highly curated risk metrics thanks to our partners at Aegis Dispute Resolution, we also include a Monte Carlo simulator for predictive analysis of your schedule based on past performing factors. The simulation, while similar to offerings in Primavera Risk Management, cuts the simulation time down dramatically and does not require a dedicated piece of software to perform.
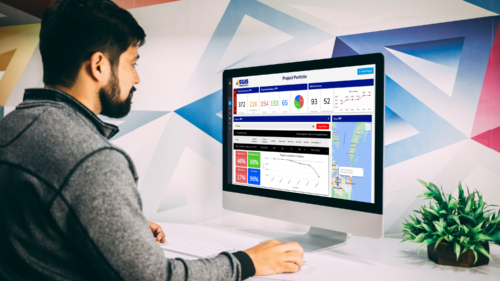
Dashboard Metrics just got a whole lot prettier.


- We’ve completely overhauled the header bar for project pages. In addition to important metric tracking and a quick glance at project health from various different scopes, a minimized version of the same data will stay at the top of the page no matter where you are for better referencing.
Introducing the brand new Schedules Tab
Review, manage, and download your project’s XER schedules all in one place

- Update notes can now be edited
- Automatically inserts schedules in correct sequence based on Data Date
- Make multiple changes/edits, and save changes
- Export the current schedule list
Welcome to a world without Desktop Risk Applications.
Welcome to Aegis Risk Analysis.
Working hand in hand with our Risk & Dispute Resolution team, we’ve created a fantastic piece of software that rivals the competition with ease of use and convenience. Simulate Monte Carlo statistical probabilities on the go, find out when your project is likely to finish, and get an in-depth look as to the real health of your project with Aegis Risk Analysis.

Monte Carlo Simulation (BETA)
The Monte Carlo Simulation utilizes as-built performance data to determine the likelihood of finishing on or before a particular date. By comparing this to the contractual completion date, a level of risk can be determined based on the potential for delay.
While competitor programs utilize desktop-based software that require a specific operating system, our simulation software can be run on any device right from your web browser!

Critical Path Risk (BETA)
- The Critical Path Risk component is derived from the Critical Path (CP) and the Secondary (SCP) and Tertiary (TCP) paths.
- Analyzing the Critical Path and sub-critical paths provides valuable trending and stability information. It provides the Project management team a tool to evaluate its current and future forecasts. With each update, the Project will be provided trends which will give the team the ability to understand and prepare for current and potential CP risk factors.

Critical Path Reliability (BETA)
- Critical Path Reliability assesses the reliability of the critical path by measuring the consistency of the activities on the critical path and logic ties between them.
The overall score for Critical Path Reliability is an average of the Activity Consistency and the Logic Consistency.
- Activity Consistency gauges if critical activities remain critical, with a zero indicating a total path change and 100 indicating an identical path between the schedules, after correcting for completed activities.
- Logic Consistency measures changes in the driving logic ties along the critical path of both the base schedule and the update. The values of the base logic and update logic are averaged for an overall Logic Consistency score.
Go more in depth with detailed Schedule Analysis breakout lists in Quality Control

NEW – Schedule Analysis
- Based on feedback from Aegonians and Clients, we’ve expanded how you can interact with our schedule analysis in a big way!
- You can now see the activities included in each analysis group. Select a group to review the activities/relationships associated, or export the full Excel report for analysis
- Need to find a specific activity or relationship? Use the search bar above the table to narrow down to a specific task name or code.
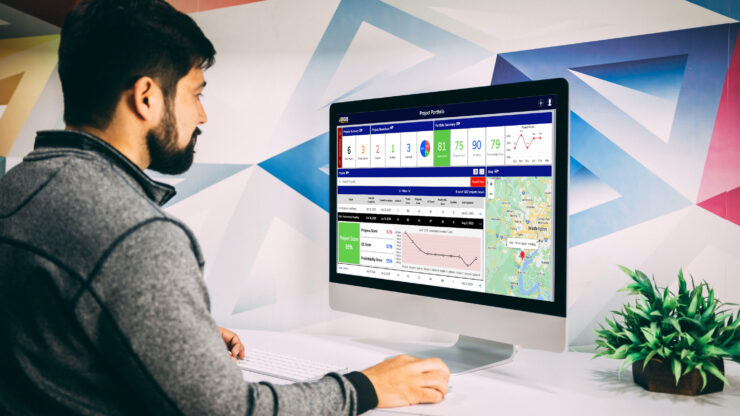
Revamp of the Project Portfolio Page

- Added “Projects On-Track”
- All Top-row visuals now filter the Project List when clicked
- Important metrics are now visible right from the project’s listing and can be sorted and filtered.
- Project list selections provide a snapshot of that project’s performance
- The arrow to the right launches directly to that project’s dashboard
Updates to the Project Overview Screen

UPDATED – Milestones Chart
- Selected Milestones are now all displayed on a single chart, with the option to select/de-select specific milestones for direct or overall comparison

Recent Posts
The Aegis Companies and Pompeian: A case study in effective construction management

Meet Mike Carey – Senior Vice President of Construction Management

Maximizing the impact of project controls in construction management
Inside Aegis Analytics: Risk Management
Inside Aegis Analytics: Ensuring schedule quality

AACE Region 2 Northeast Symposium: Elevating project management standards with Aegis
Inside Aegis Analytics: Metrics that matter